> ## Documentation Index
> Fetch the complete documentation index at: https://docs.mx.com/llms.txt
> Use this file to discover all available pages before exploring further.
# Investments Widget Overview
The Investments Widget shows a user's investment accounts in one place and analyzes their investment data, offering insight into a portfolio's composition and market positioning.
 This is how the widget appears when no data is available.
 ## Key Features
* View investment account details like gains and losses
* Visualize allocations
* See total portfolio value
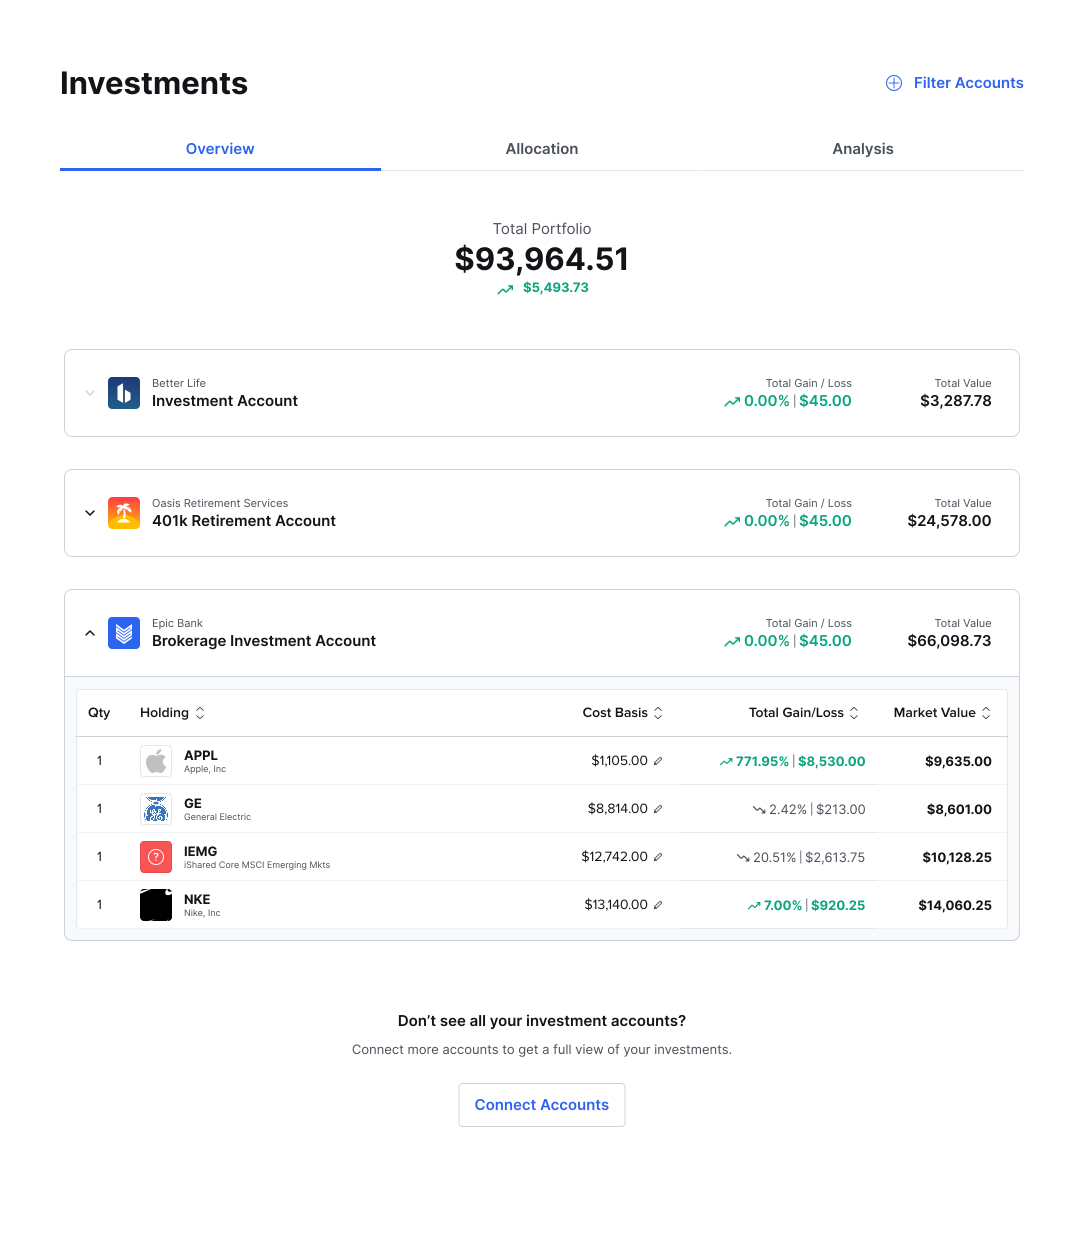
**Overview** displays the total portfolio value and gain/loss, and then each linked account and its gain/loss percentage individually. Selecting the arrow next to an account will expand the row and display the holdings, cost basis, market value, and other data.
**Allocation** shows asset distribution across categories such as:
* Cash
* U.S. stocks
* Foreign stocks
* U.S. bonds
* Other asset classes
Each asset can further show individual trade tickers for deeper insight. The chart shows the holdings plus the cash balance.
## Key Features
* View investment account details like gains and losses
* Visualize allocations
* See total portfolio value
**Overview** displays the total portfolio value and gain/loss, and then each linked account and its gain/loss percentage individually. Selecting the arrow next to an account will expand the row and display the holdings, cost basis, market value, and other data.
**Allocation** shows asset distribution across categories such as:
* Cash
* U.S. stocks
* Foreign stocks
* U.S. bonds
* Other asset classes
Each asset can further show individual trade tickers for deeper insight. The chart shows the holdings plus the cash balance.
 **Analysis** shows the portfolio positioning across market capitalization (small, mid, large) and valuation style (value, core, growth).
