> ## Documentation Index
> Fetch the complete documentation index at: https://docs.mx.com/llms.txt
> Use this file to discover all available pages before exploring further.
# Trends Widget Overview
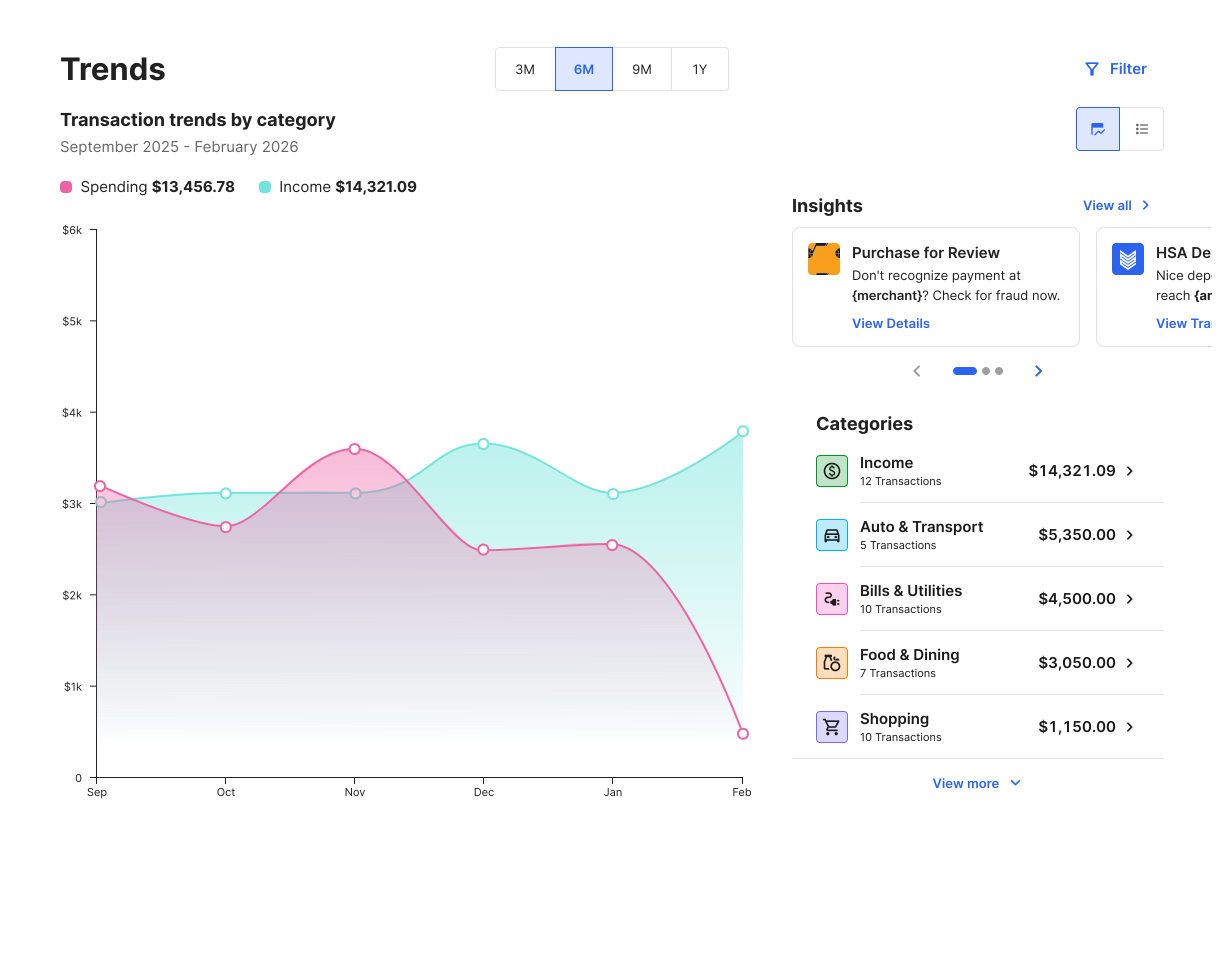
The Trends Widgets lets end users view their income and spending in categories over the last 3, 6, 9, or 12 months in one visualization.
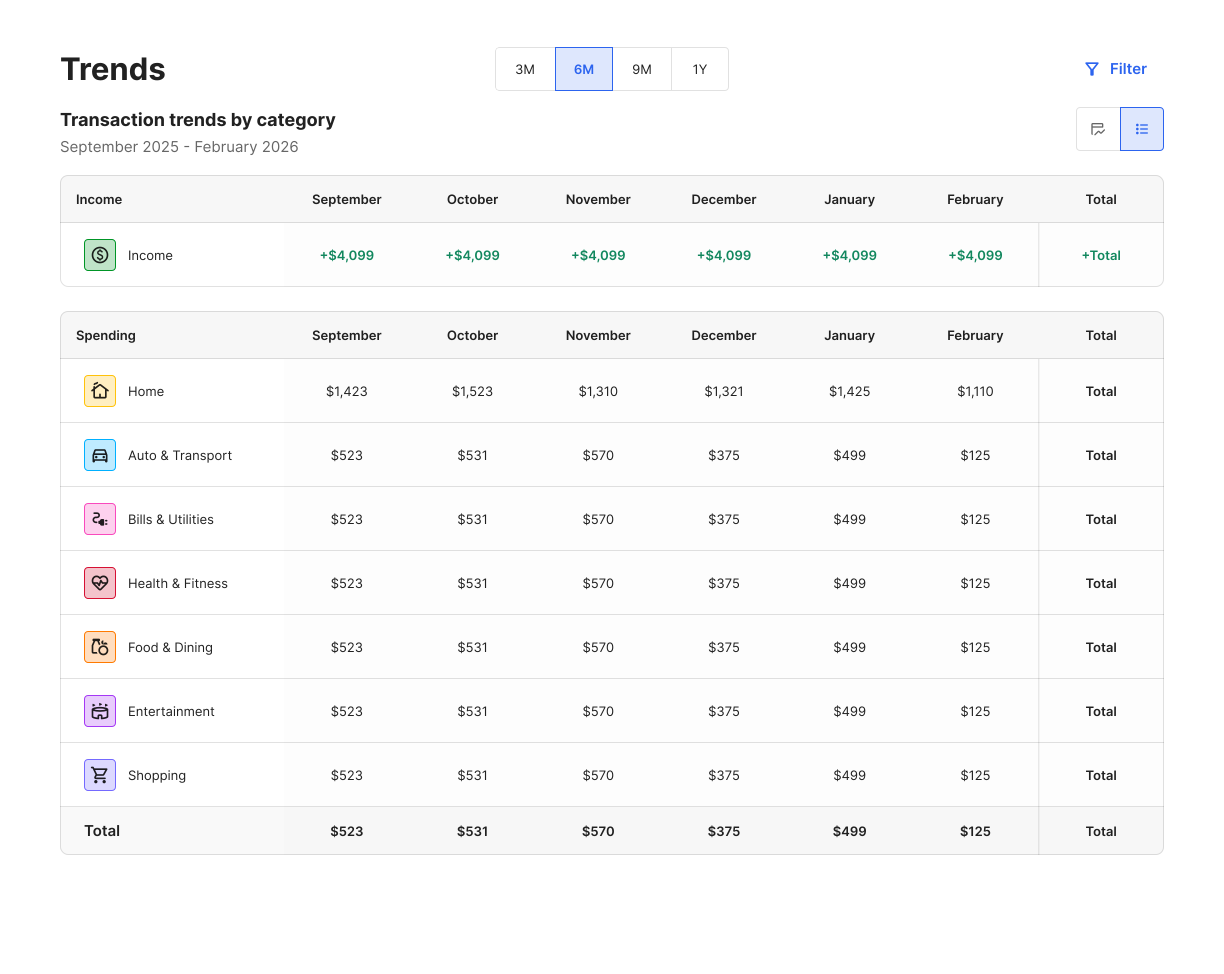
 You can also view trends in a table format to see specific dollar amounts for each category.
 Two smaller views of the widget are available (mini and micro). These views display key information and drive traffic to the full widget for more details.
 Two smaller views of the widget are available (mini and micro). These views display key information and drive traffic to the full widget for more details.
 This is how the widget appears without any data.
 The graph shows income in green and spending in pink. Selecting a specific category will open a drawer which displays a category-specific graph and lists the associated transactions.
If spending in a category is less than 3%, then it's included under the **Other** category.
## Key Features
* View transactions by category over the last three months, six months, nine months, or year
* Select a category and view income and spending by subcategory
* Filter the accounts shown
**NOTE**
Transactions categorized as `Transfers` or `Investments` won't display in this widget. For a full list of categories, see our [API reference](/api-reference/platform-api/reference/transactions#transaction-categories).
The graph shows income in green and spending in pink. Selecting a specific category will open a drawer which displays a category-specific graph and lists the associated transactions.
If spending in a category is less than 3%, then it's included under the **Other** category.
## Key Features
* View transactions by category over the last three months, six months, nine months, or year
* Select a category and view income and spending by subcategory
* Filter the accounts shown
**NOTE**
Transactions categorized as `Transfers` or `Investments` won't display in this widget. For a full list of categories, see our [API reference](/api-reference/platform-api/reference/transactions#transaction-categories).