> ## Documentation Index
> Fetch the complete documentation index at: https://docs.mx.com/llms.txt
> Use this file to discover all available pages before exploring further.
# Client Dashboard
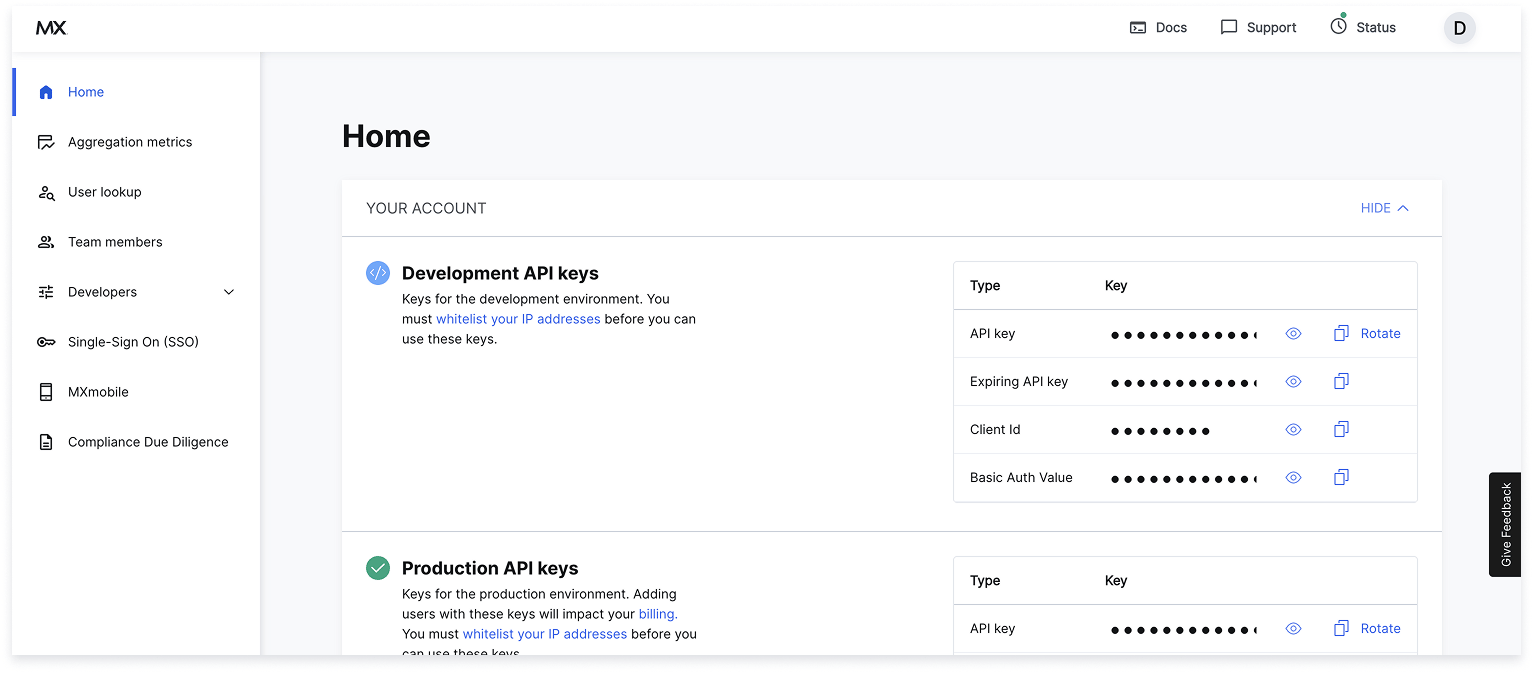
The Client Dashboard is a portal to manage your integration with MX products. When you first use it, you may want to:
* [Add team members](#add-team-members) and set their role
* [View, copy, and rotate development & production API keys](/resources/client-dashboard/manage-api-keys)
* [Whitelist IP addresses](#whitelist-ip-addresses)
* [Register for OAuth](#register-for-oauth)
* Select **Compliance Due Diligence** to access security, compliance, and due diligence documents
**SSO LOGIN**
If needed, you can [set up an SSO SAML login](/resources/client-dashboard/how-to-setup-saml-sso) for the Client Dashboard.
 ## More Features
Compare your connection performance with MX's platform-wide results.
View a user's recent connection attempts and related events.
Put your mobile app in maintenance mode to disable some/all its features.
Create and manage webhooks to know when key events occur.
## Add Team Members
To add new team members:
1. On the Home page, select the Add Team Members button or select Team members from the left-hand navigation. A list of team members appears.
2. Select the + Add Team Members link at the top right. The Add team member window appears.
3. Add the team member's:
* First Name
* Last Name
* Email
* Role
You can also select the **...** button in the Actions column to edit or delete an existing team member.
**ACCESS MANAGEMENT RESPONSIBILITY**
You're responsible for removing access for anyone no longer employed with your organization.
## Aggregation Metrics
In the dashboard, **Aggregation metrics** shows aggregation-attempt results for financial institutions. Use it to compare your connection performance with MX's platform-wide results.
To view connection metric details for the highest-volume institutions on the MX platform:
1. Log in to Client Dashboard.
2. Select **Aggregation metrics**.
Select an institution to see detailed metrics for that connection:
* User and system errors
* Connection rates — your users compared with all MX clients and the selected institution.
## Block an Institution
To block an institution or routing number:
1. In Client Dashboard, select **Developers**, then **Blocks** in the dropdown.
2. Select either:
* **Institutions** to prevent end users from finding the institution in the institution search list.
* **Routing Numbers** to prevent end users from initiating microdeposits using that specific routing number.
3. Depending on your previous selection, select either **BLOCK INSTITUTION** or **BLOCK ROUTING NUMBERS**.
4. Enter the institution or routing number, then select **BLOCK**.
## Register for OAuth
OAuth connections are tokenized connections that let one application interact with another without requiring users to re-enter credentials. Credentials are handled by the OAuth provider and exchanged for a token MX can use, providing a more secure connection for institutions and their customers.
To register for OAuth in Client Dashboard:
1. In Client Dashboard, select **Developers**, then **OAuth**.
2. Complete the OAuth registration form.
3. Select **Submit**. MX will register your company for all OAuth-enabled connections.
The registration form includes these settings and fields. Only the App logo and App name are visible to users:
* App logo — Must be a 100×100 px `.png` file.
* App name — Displayed to users; choose a recognizable name.
* Abbreviated app name — A shorter name for your app.
* App description — Brief summary of the app.
* Company website — Your company's primary website.
* Street Address, City, State/Province/Region, Postal/Zip Code, Country — Your company's address.
* Support email — The email address to contact your company's support team.
* Support phone number — The phone number to contact your company's support team.
* Support URL — The web address for your company's support team.
## Reset Your Password
It's best practice to occasionally reset passwords used in Client Dashboard.
To change your password:
1. On the Client Dashboard sign-in screen, select **Forgot your password?**
2. Enter your email address, then select **Request New Password**. An email will be sent to the address provided.
3. Open the email from MX and select **Change my password**. You'll be taken to a webpage to set a new password.
4. Enter your new password in the **New Password** field.
5. Re-enter your password in the **Confirm New Password** field, then select **Change My Password**. If successful, you'll be redirected back to the login page.
## View Logs
In Client Dashboard, logs are available to help you test and troubleshoot API connections and issues.
You can view logs for several of our APIs, including details about:
* Webhooks and MX Platform statistics
* Total number of requests and their average duration.
The type of logs available depend on which MX products and APIs your organization is using.
**INFO**
**Logs** displays logs from up to 7 days in the past in the production environment. To view logs for your integration environment, reach out to your MX representative.
To view a log payload:
1. In Client Dashboard, select **Developer** to open the dropdown menu.
2. Select **Logs**.
3. Select a tab at the top of the table to view logs for that product.
4. Select any table row to view the payload. The **Log Payload** panel opens on the right where you can see the call and response information that can help you identify connection issues.
## Whitelist IP Addresses
All IP addresses that make calls to the Platform API, in any environment, must be whitelisted.
Whitelisting ensures API calls come from approved, secure sources; calls from non‑whitelisted addresses are flagged as a security risk. Some addresses (for example, those originating outside North America) may require manual approval by MX.
**LIMITATIONS**
* MX supports only IP addresses or IP ranges (not domains).
* Supported IP ranges are `/22` through `/32`.
* Dynamic IP addresses aren't supported — only static IPs may be whitelisted.
To view and whitelist an IP address:
1. In Client Dashboard, go to the API Keys page. In the Whitelisted IP Addresses section you can view existing entries.
2. Select **+ Whitelist IP address**.
3. Enter the new IP address or IP range. Separate multiple IP addresses with a comma.
4. Select **Confirm**. Approved addresses are added to the list. Approval can take several days—contact MX if you need assistance.
## More Features
Compare your connection performance with MX's platform-wide results.
View a user's recent connection attempts and related events.
Put your mobile app in maintenance mode to disable some/all its features.
Create and manage webhooks to know when key events occur.
## Add Team Members
To add new team members:
1. On the Home page, select the Add Team Members button or select Team members from the left-hand navigation. A list of team members appears.
2. Select the + Add Team Members link at the top right. The Add team member window appears.
3. Add the team member's:
* First Name
* Last Name
* Email
* Role
You can also select the **...** button in the Actions column to edit or delete an existing team member.
**ACCESS MANAGEMENT RESPONSIBILITY**
You're responsible for removing access for anyone no longer employed with your organization.
## Aggregation Metrics
In the dashboard, **Aggregation metrics** shows aggregation-attempt results for financial institutions. Use it to compare your connection performance with MX's platform-wide results.
To view connection metric details for the highest-volume institutions on the MX platform:
1. Log in to Client Dashboard.
2. Select **Aggregation metrics**.
Select an institution to see detailed metrics for that connection:
* User and system errors
* Connection rates — your users compared with all MX clients and the selected institution.
## Block an Institution
To block an institution or routing number:
1. In Client Dashboard, select **Developers**, then **Blocks** in the dropdown.
2. Select either:
* **Institutions** to prevent end users from finding the institution in the institution search list.
* **Routing Numbers** to prevent end users from initiating microdeposits using that specific routing number.
3. Depending on your previous selection, select either **BLOCK INSTITUTION** or **BLOCK ROUTING NUMBERS**.
4. Enter the institution or routing number, then select **BLOCK**.
## Register for OAuth
OAuth connections are tokenized connections that let one application interact with another without requiring users to re-enter credentials. Credentials are handled by the OAuth provider and exchanged for a token MX can use, providing a more secure connection for institutions and their customers.
To register for OAuth in Client Dashboard:
1. In Client Dashboard, select **Developers**, then **OAuth**.
2. Complete the OAuth registration form.
3. Select **Submit**. MX will register your company for all OAuth-enabled connections.
The registration form includes these settings and fields. Only the App logo and App name are visible to users:
* App logo — Must be a 100×100 px `.png` file.
* App name — Displayed to users; choose a recognizable name.
* Abbreviated app name — A shorter name for your app.
* App description — Brief summary of the app.
* Company website — Your company's primary website.
* Street Address, City, State/Province/Region, Postal/Zip Code, Country — Your company's address.
* Support email — The email address to contact your company's support team.
* Support phone number — The phone number to contact your company's support team.
* Support URL — The web address for your company's support team.
## Reset Your Password
It's best practice to occasionally reset passwords used in Client Dashboard.
To change your password:
1. On the Client Dashboard sign-in screen, select **Forgot your password?**
2. Enter your email address, then select **Request New Password**. An email will be sent to the address provided.
3. Open the email from MX and select **Change my password**. You'll be taken to a webpage to set a new password.
4. Enter your new password in the **New Password** field.
5. Re-enter your password in the **Confirm New Password** field, then select **Change My Password**. If successful, you'll be redirected back to the login page.
## View Logs
In Client Dashboard, logs are available to help you test and troubleshoot API connections and issues.
You can view logs for several of our APIs, including details about:
* Webhooks and MX Platform statistics
* Total number of requests and their average duration.
The type of logs available depend on which MX products and APIs your organization is using.
**INFO**
**Logs** displays logs from up to 7 days in the past in the production environment. To view logs for your integration environment, reach out to your MX representative.
To view a log payload:
1. In Client Dashboard, select **Developer** to open the dropdown menu.
2. Select **Logs**.
3. Select a tab at the top of the table to view logs for that product.
4. Select any table row to view the payload. The **Log Payload** panel opens on the right where you can see the call and response information that can help you identify connection issues.
## Whitelist IP Addresses
All IP addresses that make calls to the Platform API, in any environment, must be whitelisted.
Whitelisting ensures API calls come from approved, secure sources; calls from non‑whitelisted addresses are flagged as a security risk. Some addresses (for example, those originating outside North America) may require manual approval by MX.
**LIMITATIONS**
* MX supports only IP addresses or IP ranges (not domains).
* Supported IP ranges are `/22` through `/32`.
* Dynamic IP addresses aren't supported — only static IPs may be whitelisted.
To view and whitelist an IP address:
1. In Client Dashboard, go to the API Keys page. In the Whitelisted IP Addresses section you can view existing entries.
2. Select **+ Whitelist IP address**.
3. Enter the new IP address or IP range. Separate multiple IP addresses with a comma.
4. Select **Confirm**. Approved addresses are added to the list. Approval can take several days—contact MX if you need assistance.