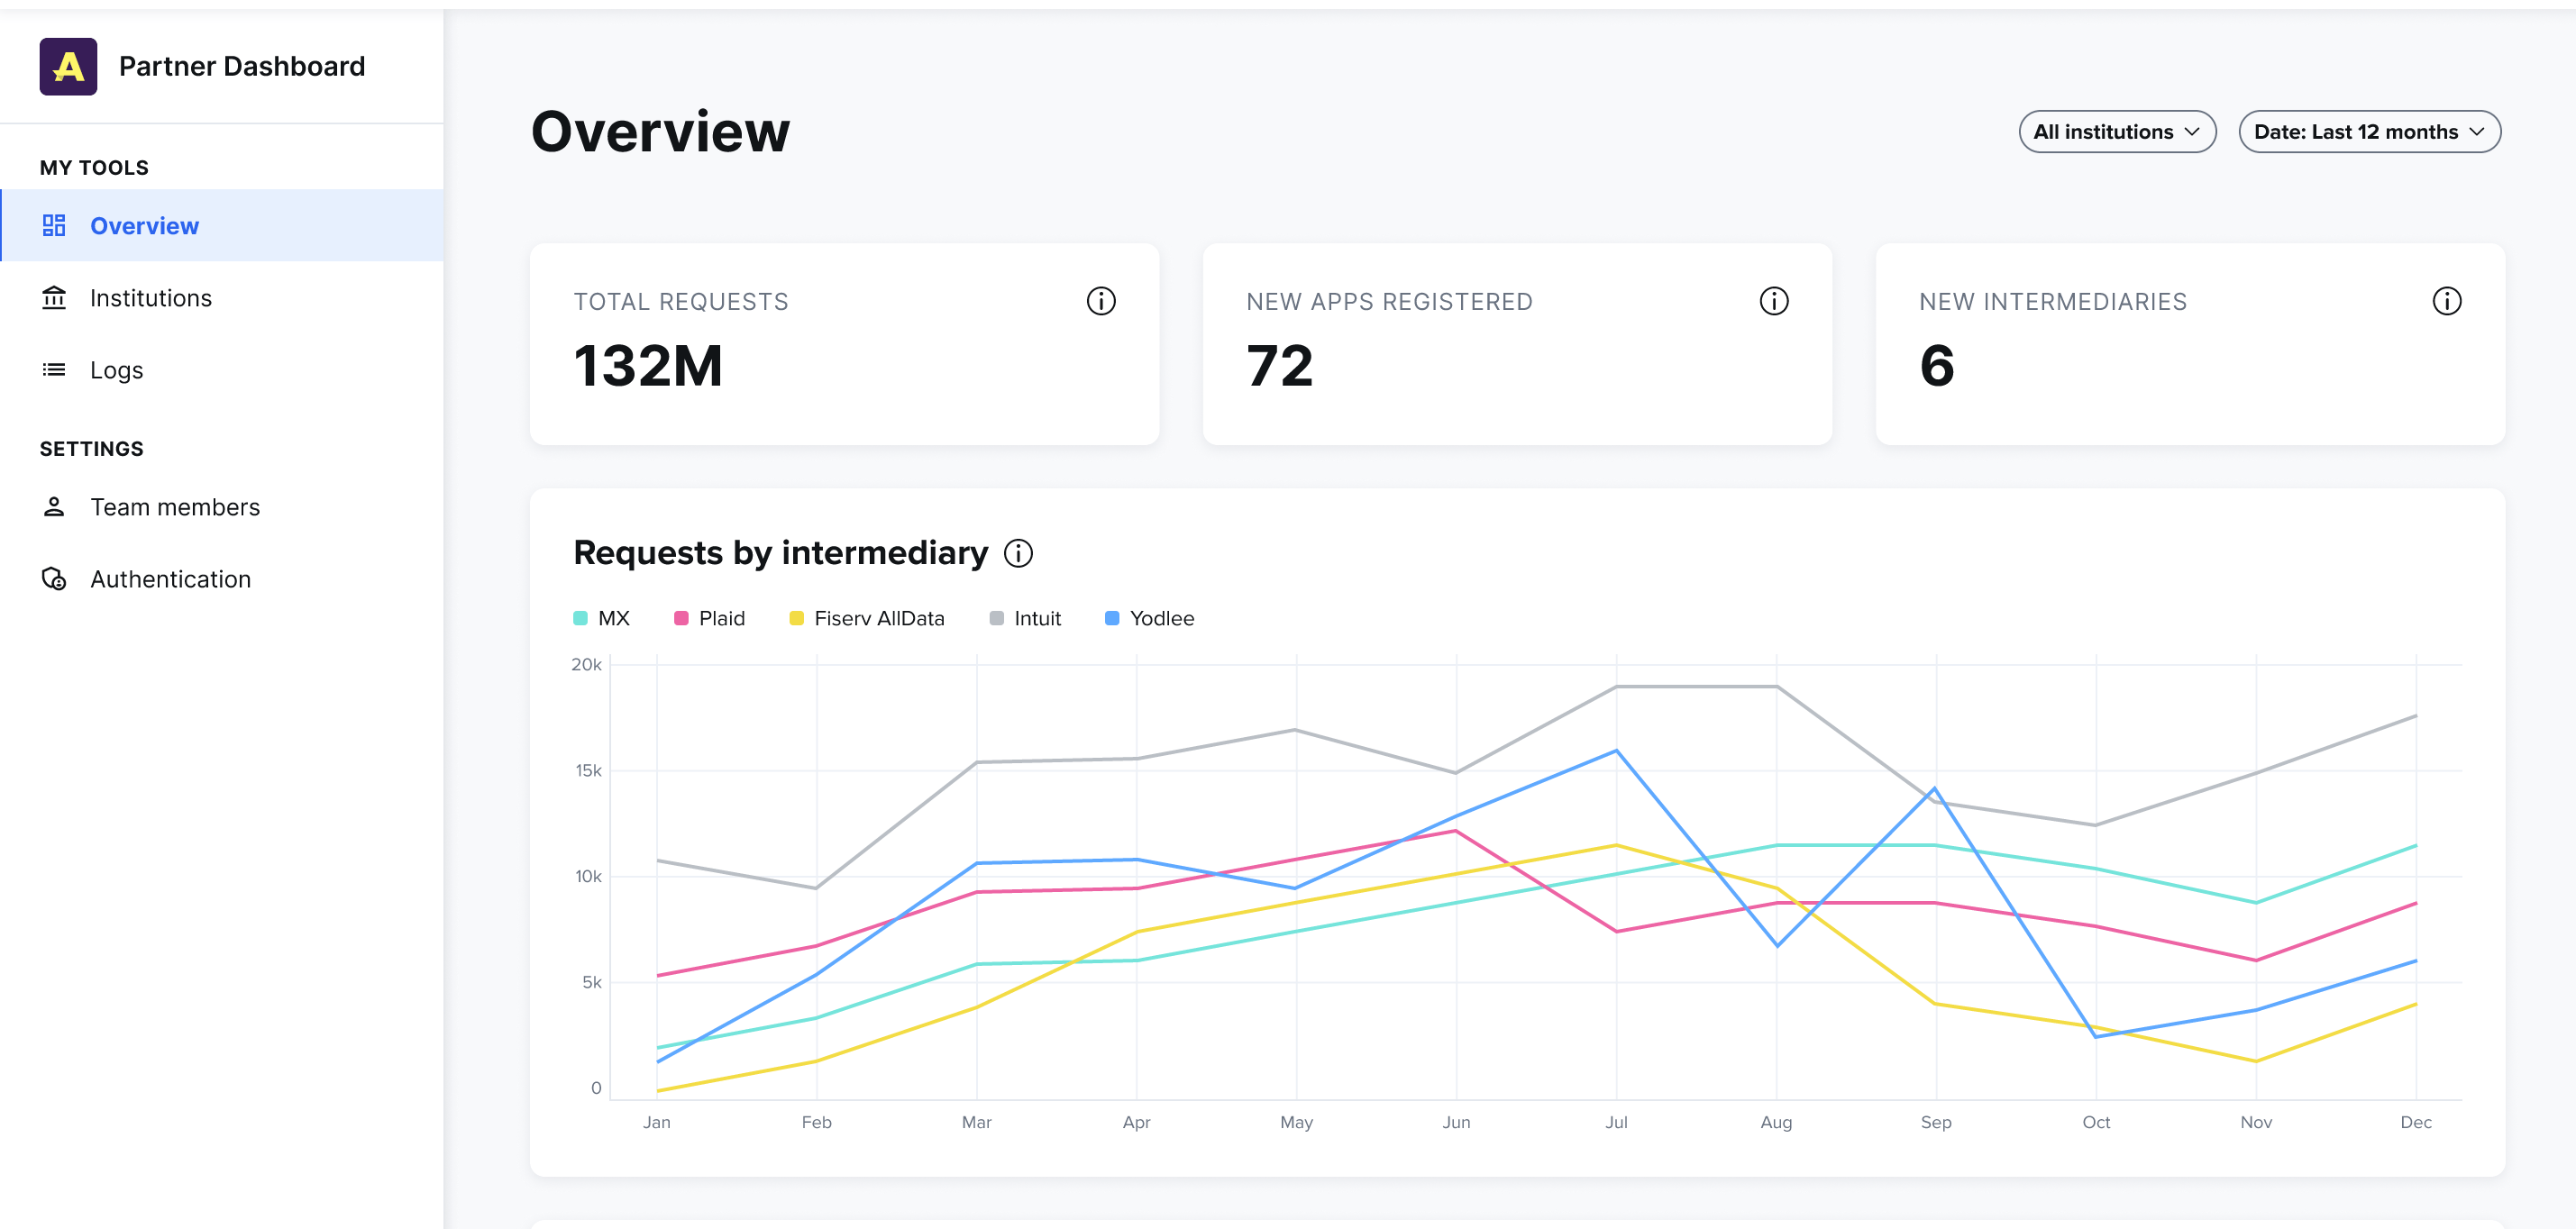
- Total requests: This card totals all requests that have been received from intermediaries and apps in the selected time frame. Data recipients will make several requests to retrieve customer data by calling the various FDX endpoints. For example,
GET /accountswould be one request. - New apps registered: This card totals all apps that were registered across all intermediaries in the selected time frame.
- New intermediaries: This card totals all intermediaries that have been added in the selected time frame.
- Requests by Intermediary: This line chart shows a historical view of all requests by intermediary. This helps you understand which intermediaries are responsible for the most requests and how that data changes over time.
- Sessions by institution: This line chart shows a historical view of all sessions by institution. This helps you understand which institution is receiving the most traffic.
- Requests per app: This bar chart shows all requests grouped by the app they’re coming from. This helps you understand which apps your institutions’ users are connecting to most.
- Top categories: This pie chart shows all requests grouped by the category of app(s) the requests are coming from. This helps you understand what features and functionality your institutions’ customers are using other apps for.
- Unique users: This line chart shows a historical count of unique users connecting to your institutions. Unique means that if a user connects to their accounts from multiple apps, they would still only be counted as one user.
- Sessions: This line chart shows a historical count of all sessions that have been initiated by intermediaries in the selected time frame. A session begins when an access token is granted and ends when it expires. All requests made with that access token are part of that session. When the token is refreshed a new session is started.
- Requests: This line chart shows a historical count of all requests that have been received from intermediaries and apps in the selected time frame. A request is counted each time one of the FDX endpoints is hit. For example,
GET /accountswould be one request.