Platform Engagement
The dashboards in this section include PFM, Mobile, and Insights.
Each dashboard has charts that give you insights into your customers’ engagement with your digital offerings.
Each chart has a timestamp to show when it was last updated — it automatically updates every 24 hours — and you can click to update.
info
The functionality of this software varies depending on which financial institution you use. Not all content in this help center will apply to your experience.
PFM
The PFM dashboard charts show information about the following:
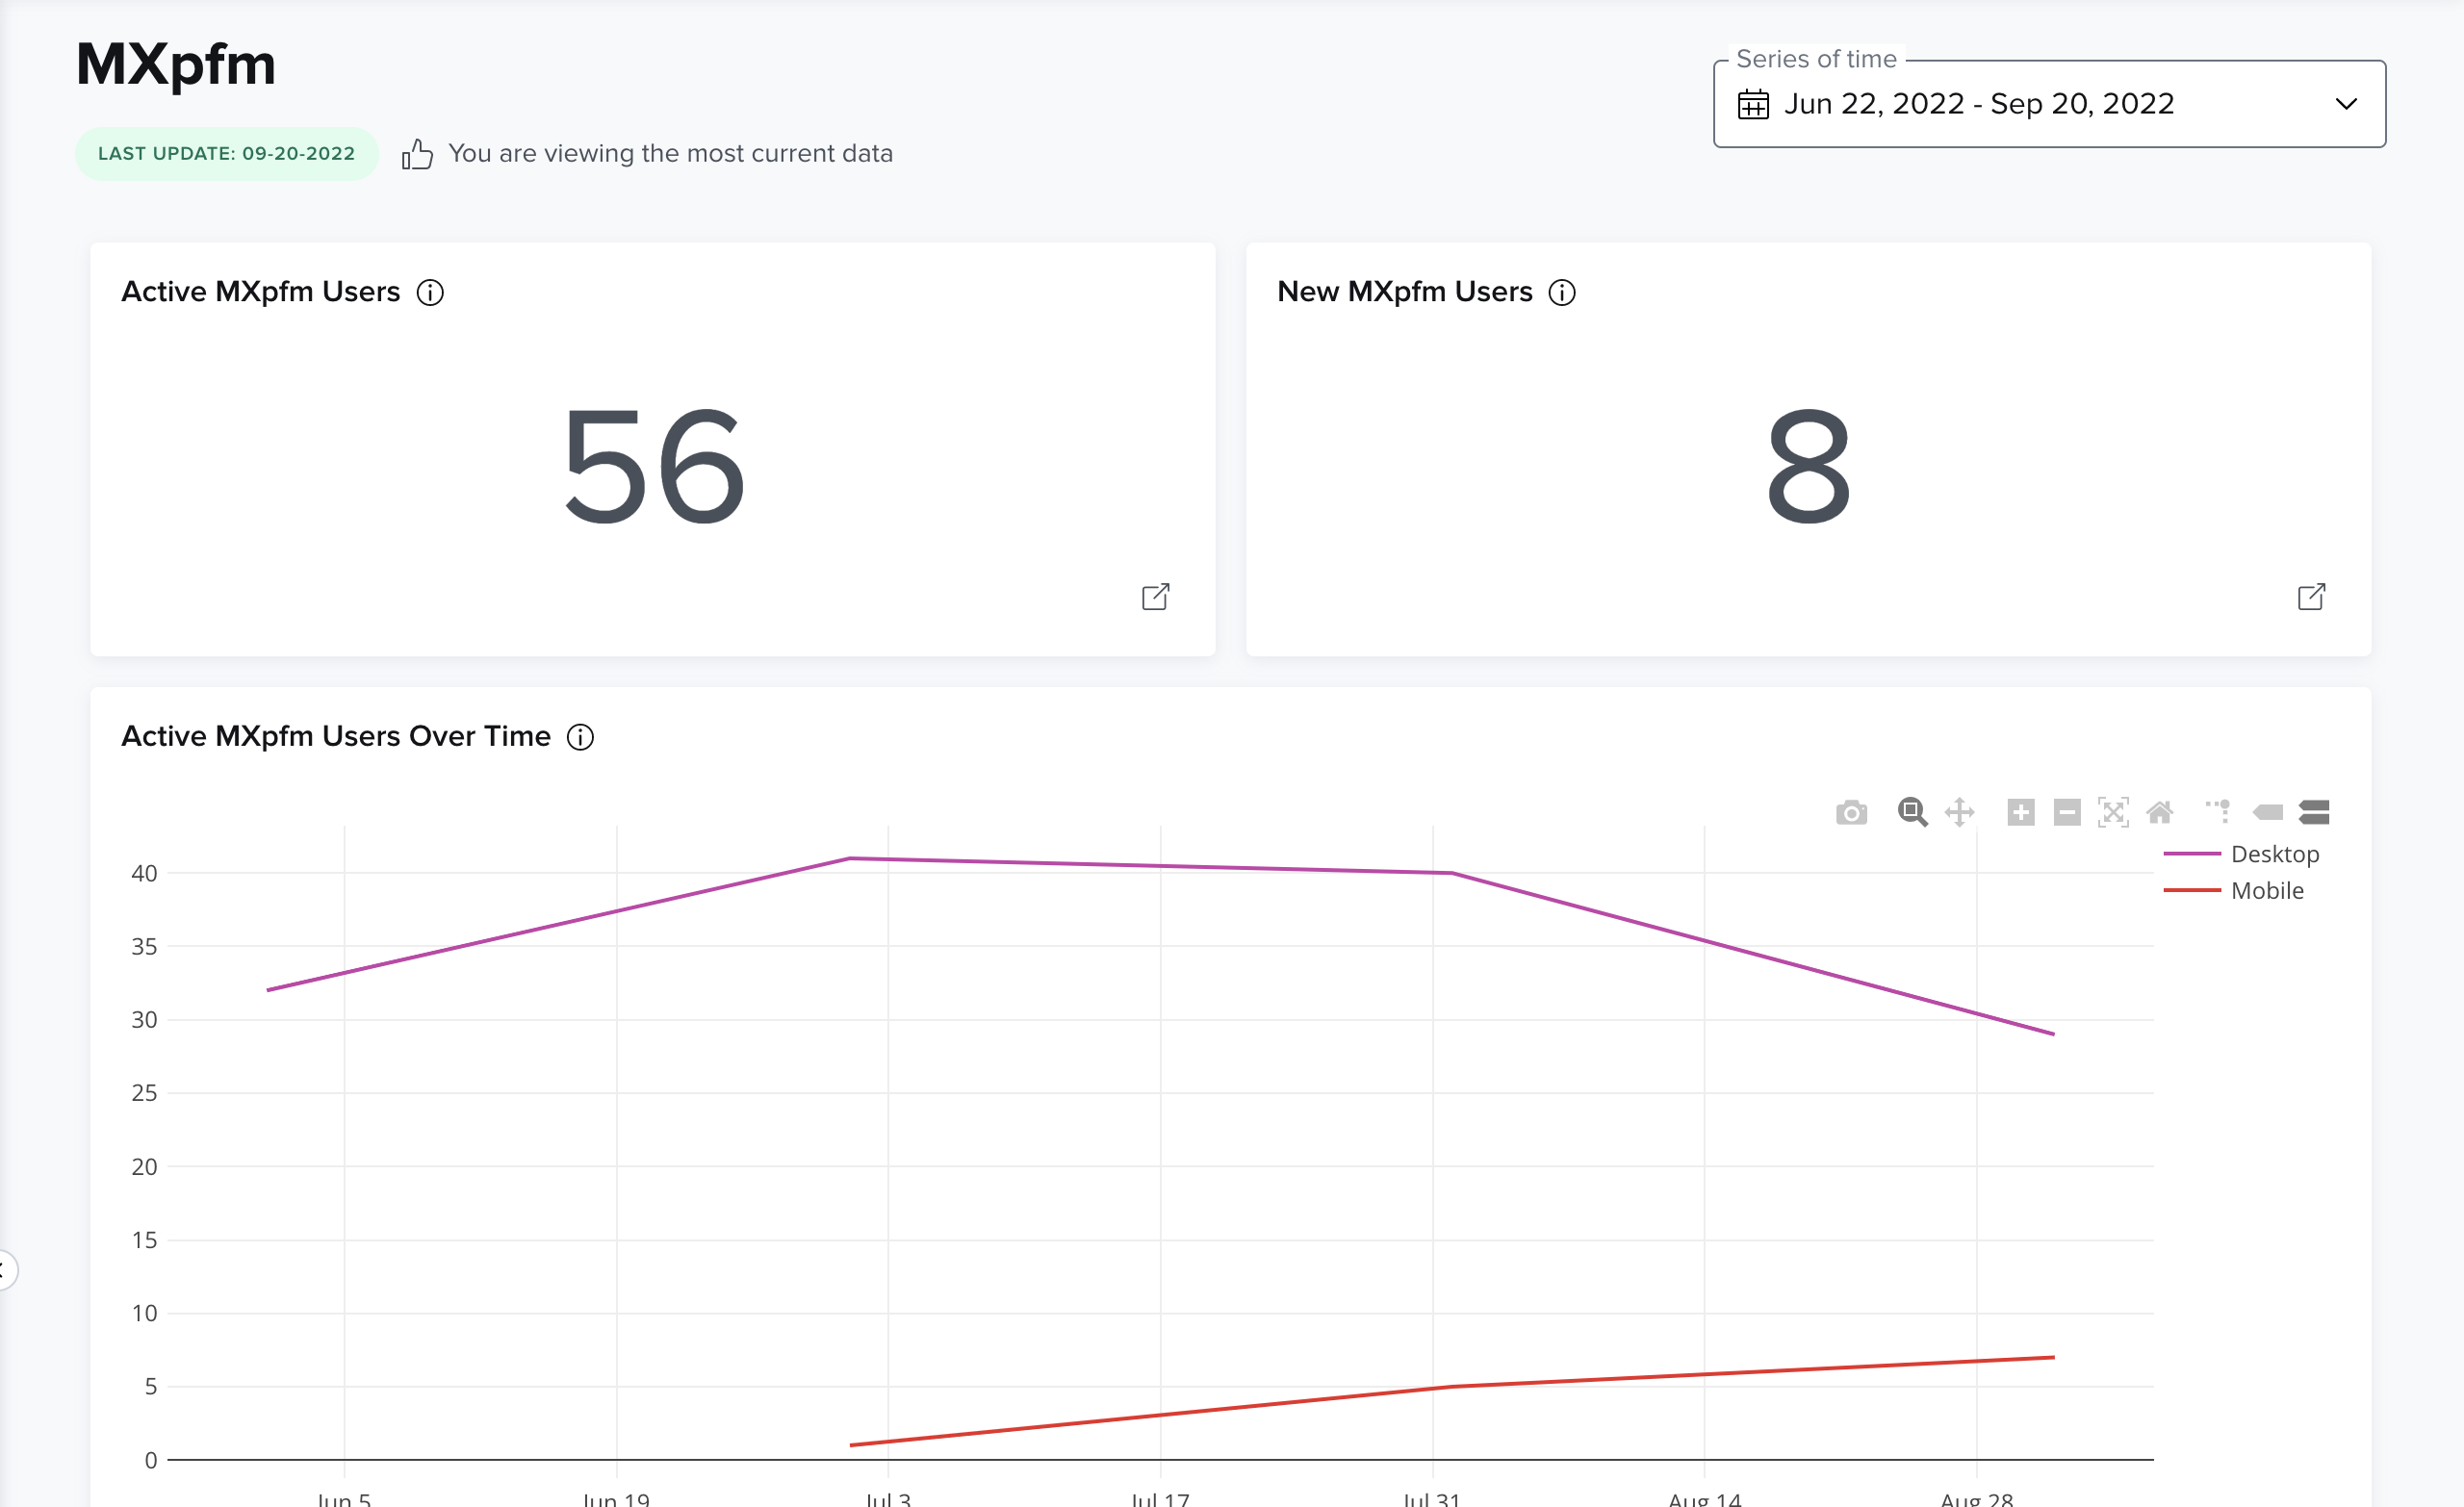
- New PFM users:This is the number of users whose first PFM session occurred during the designated period of time.
- Active PFM users: This is the number of users who have recorded at least one PFM session during the designated period of time.
- Active PFM users over time: This is the number of users who have recorded at least one PFM session during a month, shown month by month for the designated period of time.
- Pageviews per feature: A pageview is the number of times a webpage is loaded into view for a user. Repeated pageviews of a single feature are counted. Mobile and Desktop users are distinguished by unique URL routes for each experience.
- Sessions per active user: This is the total number of PFM sessions, divided by the total number of active PFM users. This gives an idea of how many times an active PFM user records a session, on average, during the designated period of time.
- Average session duration: This is the total session duration, divided by the total number of sessions during the designated period of time. This gives an idea of how long a user’s PFM session lasts, on average.
- Total pageviews: This is the total number of times a webpage is loaded into view for a user during the designated period of time.
- Active PFM users by day: This is, on average, how many active PFM users are recorded each day of the week during the designated period of time.
- Active PFM users by device: This is the total number of sessions, segmented by the device used to access PFM. Mobile and Desktop users are distinguished by unique URL routes for each experience.
- Total PFM users: This is the total number of users who have a PFM account set up. This number is used for billing purposes.
Mobile
The Mobile dashboard charts show information about the following:
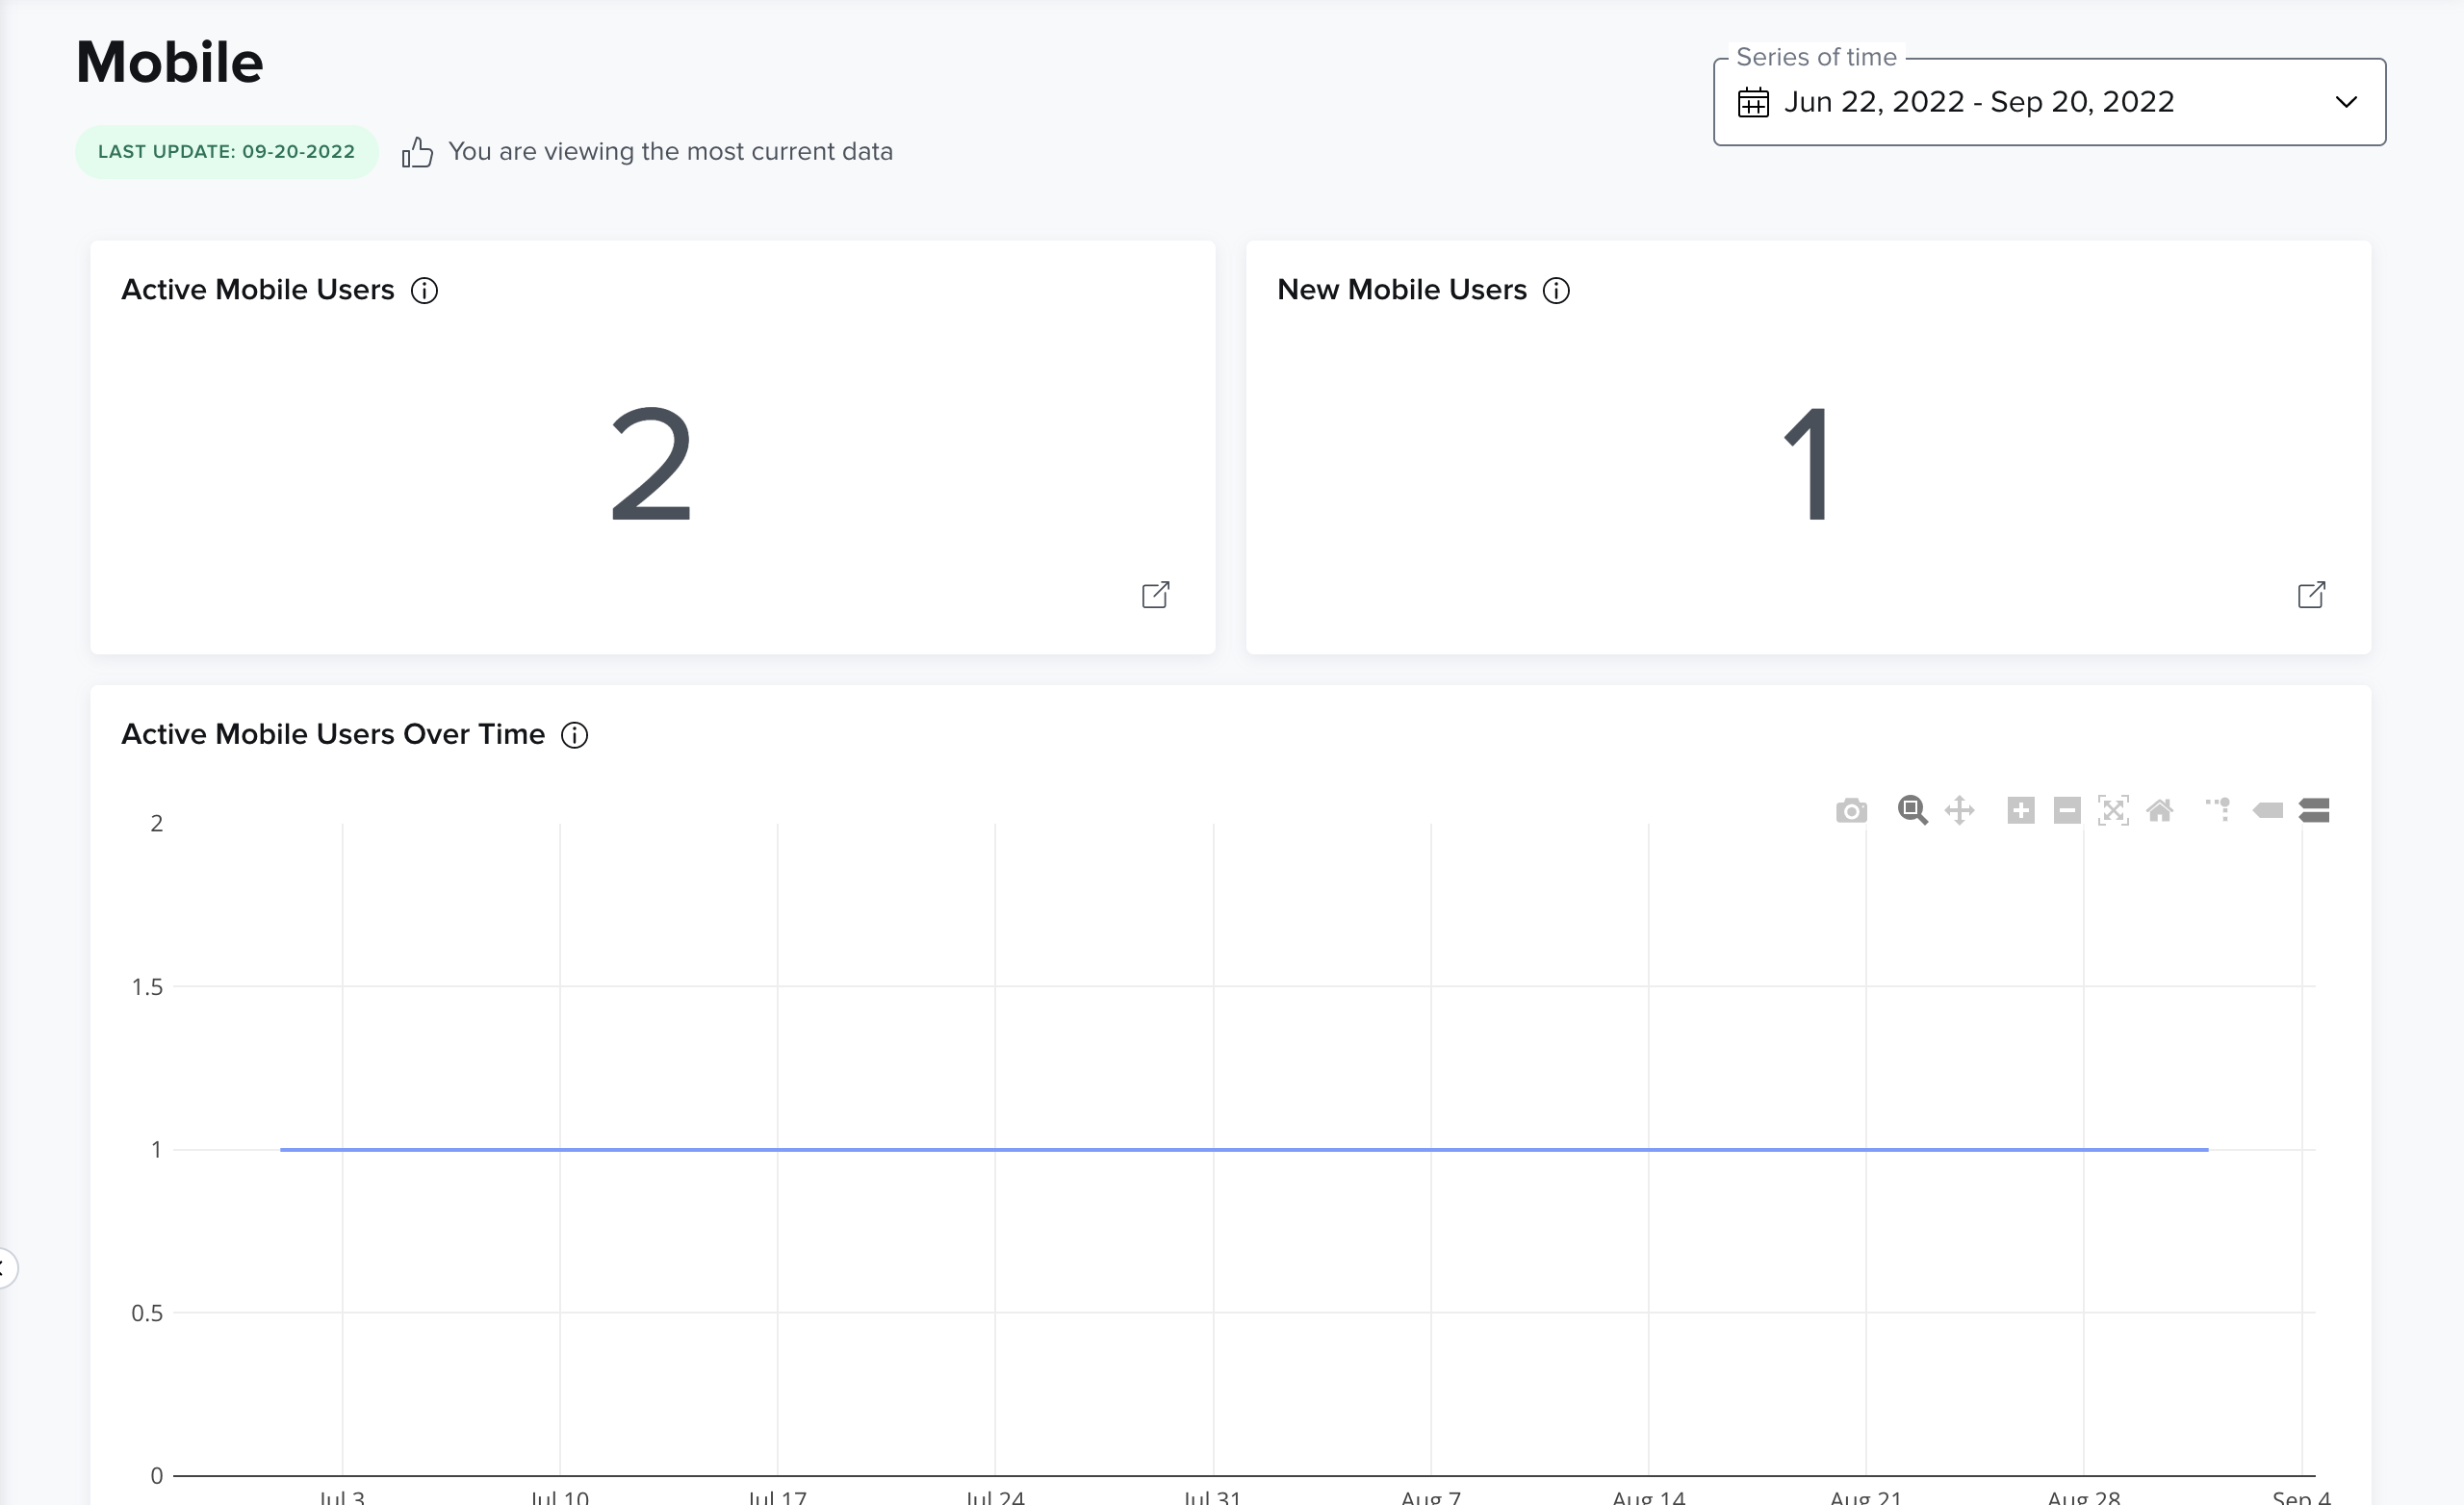
- Active Mobile users: This is the number of users who have recorded at least one Mobile session during the designated period of time.
- New Mobile users: This is the number of users whose first Mobile session occurred during the designated period of time.
- Active Mobile users over time: This is the number of users who have recorded at least one Mobile session during a month, shown month by month for the designated period of time.
- Pageviews per feature: A pageview is the number of times a webpage is loaded into view for a user. Repeated pageviews of a single feature are counted.
- Sessions per active user: This is the total number of Mobile sessions, divided by the total number of active Mobile users. This gives an idea of how many times an active Mobile user records a session, on average, during the designated period of time.
- Average session duration: This is the total session duration, divided by the total number of sessions during the designated period of time. This gives an idea of how long a user’s Mobile session lasts, on average.
- Total pageviews: This is the total number of times a webpage is loaded into view for a user during the designated period of time.
- Active Mobile users by day: This is, on average, how many active Mobile users are recorded each day of the week during the designated period of time.
- Active Mobile users by OS: This is the total number of sessions, segmented by the operating system used to access Mobile.
- Total Mobile users: This is the total number of users who have a Mobile account set up during the designated period of time. This number is used for billing purposes
Insights
The Insights dashboard charts show information about the following:
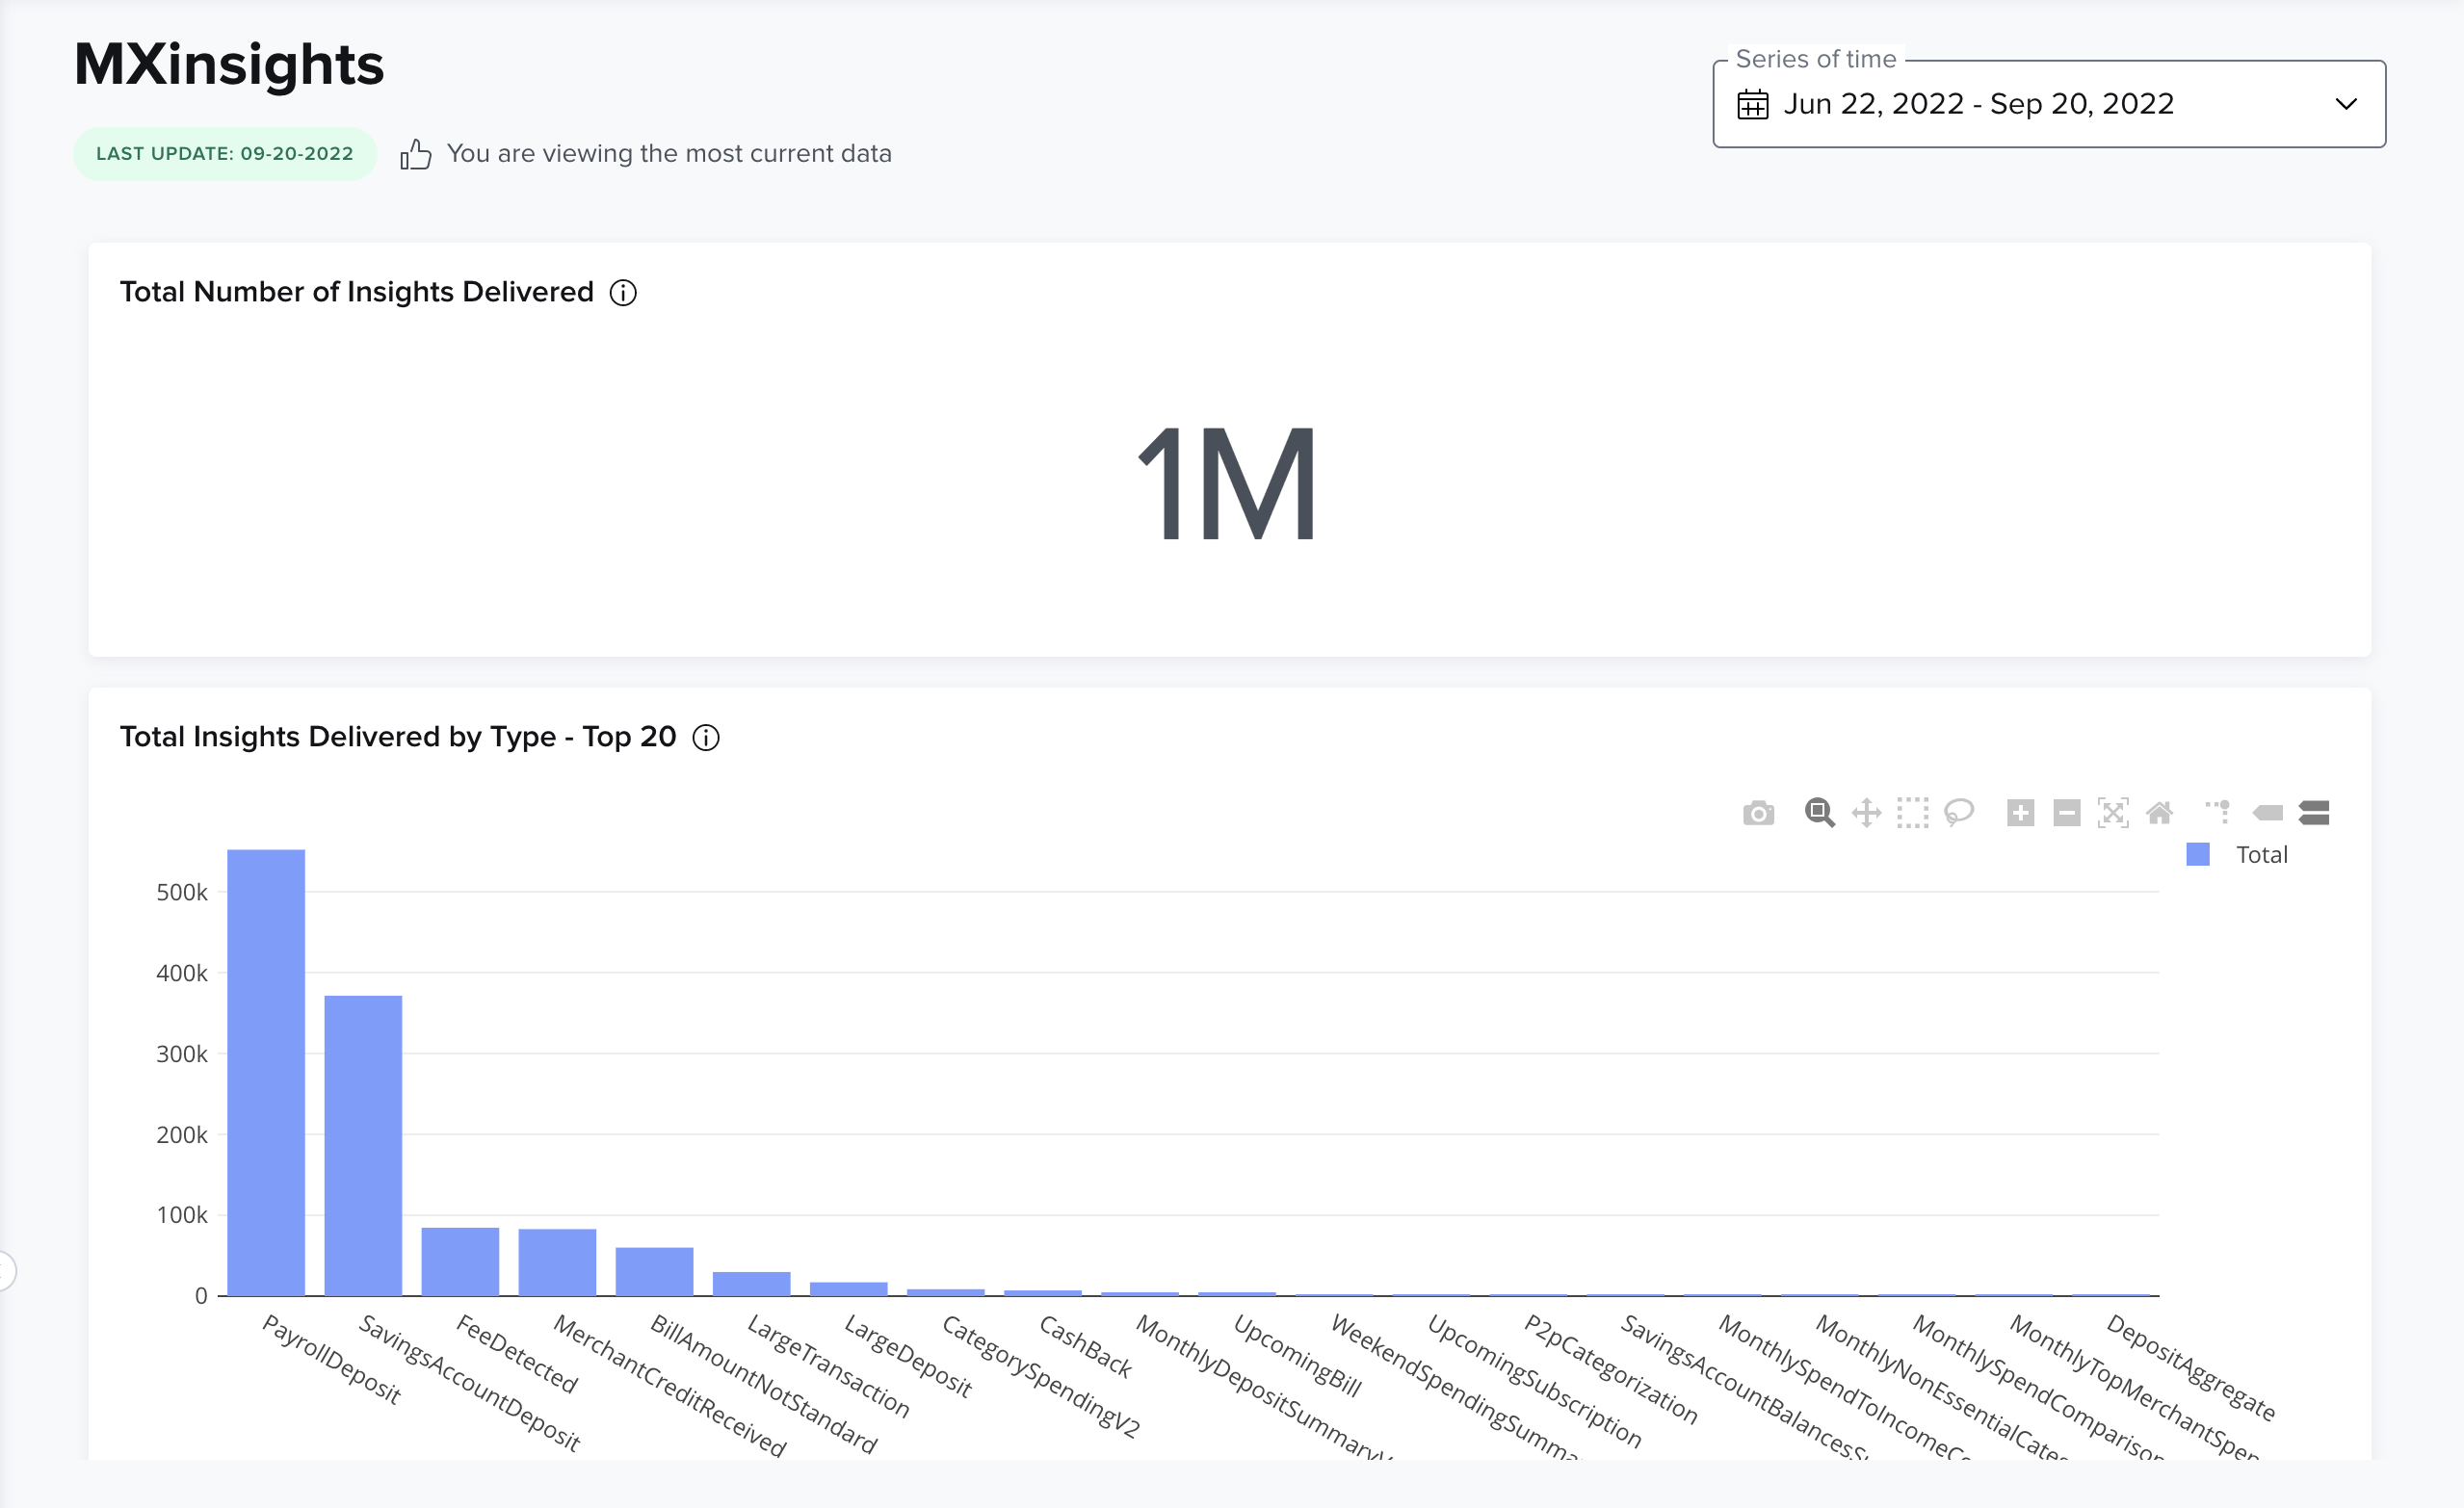
- Total number of insights delivered
- Insights delivered by type: This is the real-time number of insights delivered to your users. Each bar represents a unique type of insight.
- Total Insights users: This is the total number of users who have a Insights account set up. This number is used for billing purposes.
- Active Insights users: This is the number of users who have recorded at least one Insights session during the designated period of time.
- New Insights users: This is the number of users whose first Insights session occurred during the designated period of time.
- Active Insights users over time: This is the number of users who have recorded at least one Insights session during a month, shown month by month for the designated period of time.
- Sessions per active user: This is the total number of Insights sessions, divided by the total number of active users. This gives an idea of how many times an active user records a session, on average, during the designated period of time.
- Average session duration: This is the total session duration, divided by the total number of sessions during the designated period of time. This gives an idea of how long a user’s session lasts, on average.
- Total pageviews: This is the total number of times a webpage is loaded into view for a user during the designated period of time.
- Active Insights users by day: This is, on average, how many active users are recorded each day of the week during the designated period of time.
- Active Insights users by device: This is the total number of sessions, segmented by the device used to access Insights. Mobile and Desktop users are distinguished by unique URL routes for each experience.